If the
favored hierarchical cosmological model, LCDM, is correct, then the
Milky Way
and similarly sized galaxies should have accreted and subsequently
tidally destroyed ~200 low-mass
galaxies in the past ~12 Gyr. Kathryn Johnston and I are modelling this
process using a hybrid
semi-analytic plus N-body approach. Below are a few images from
our simulations.
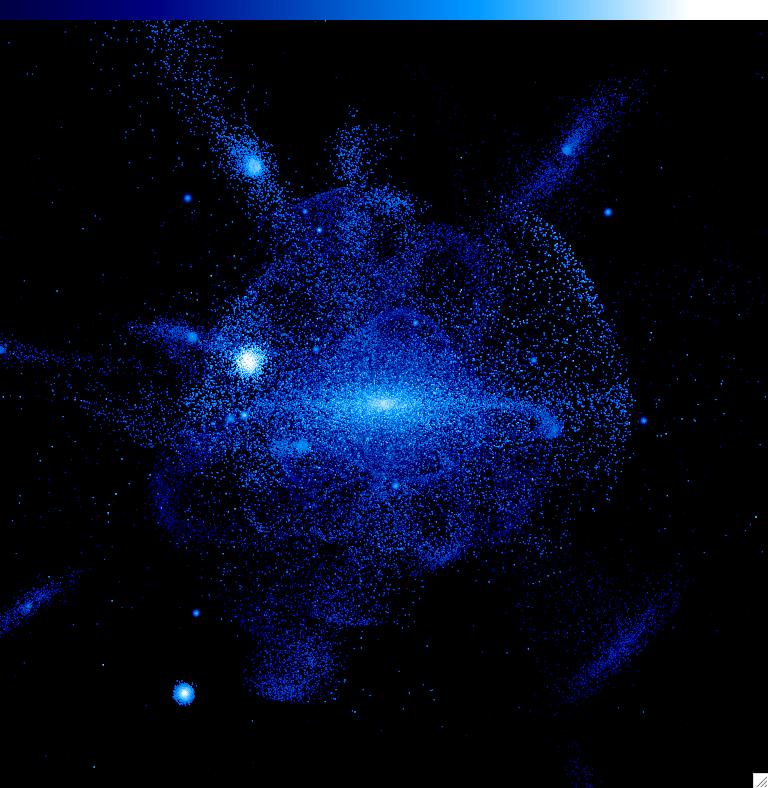
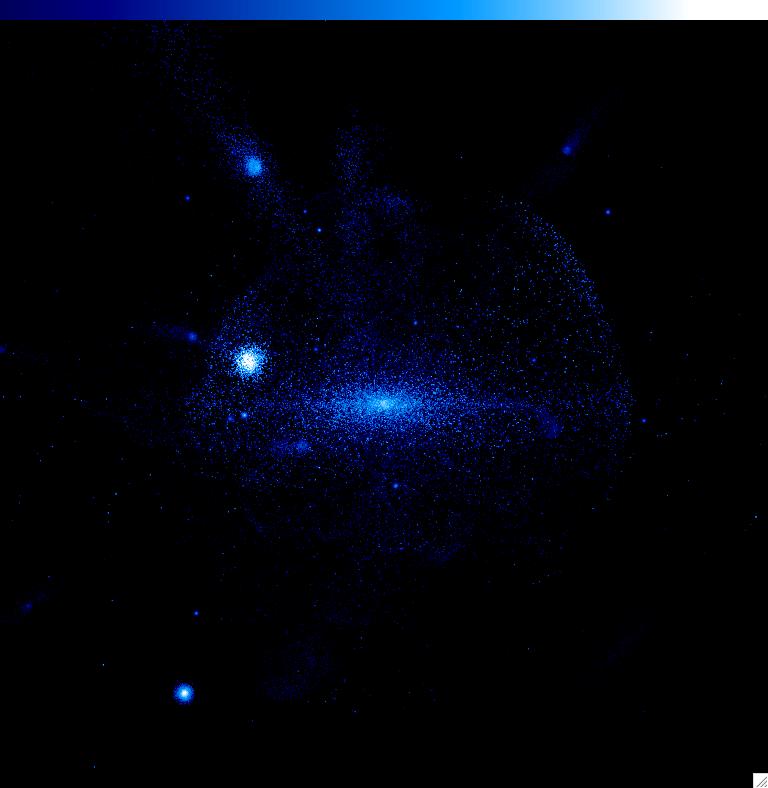
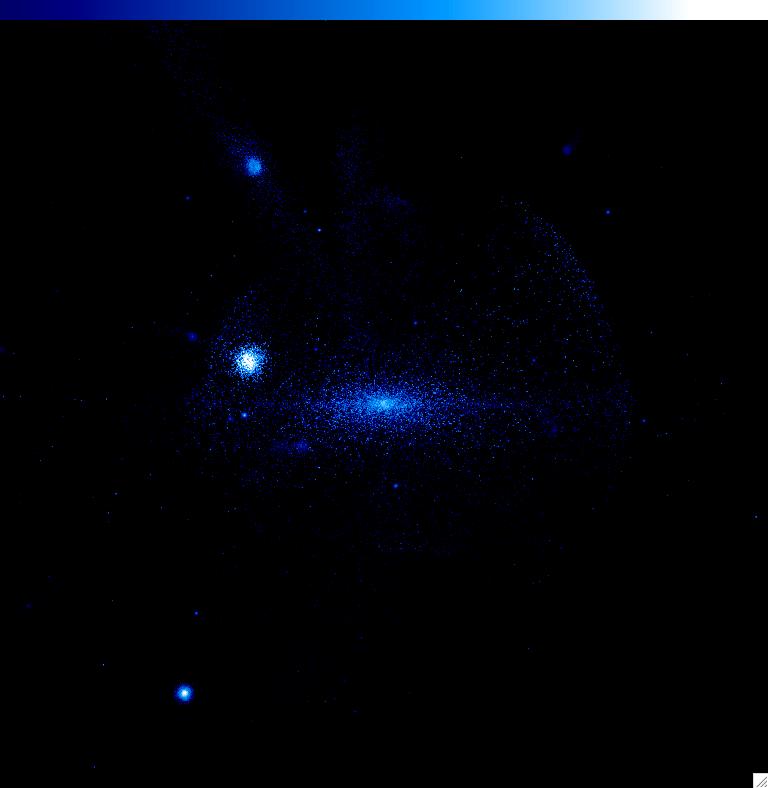
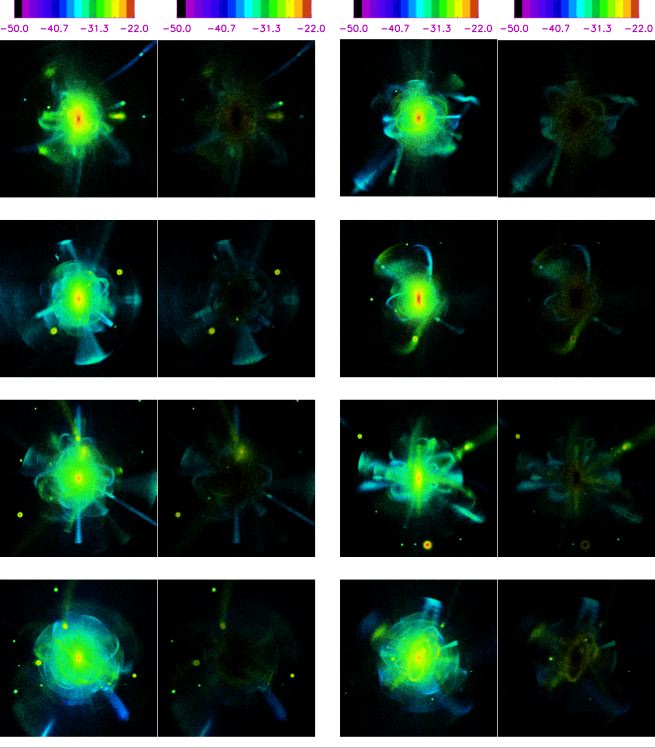
External
Images.
300 kpc x 300 kpc boxes.
By row, colors map:
Surface brightness, Fe/H, alpha/Fe, velocity dispersion, line-of-sight
velocity
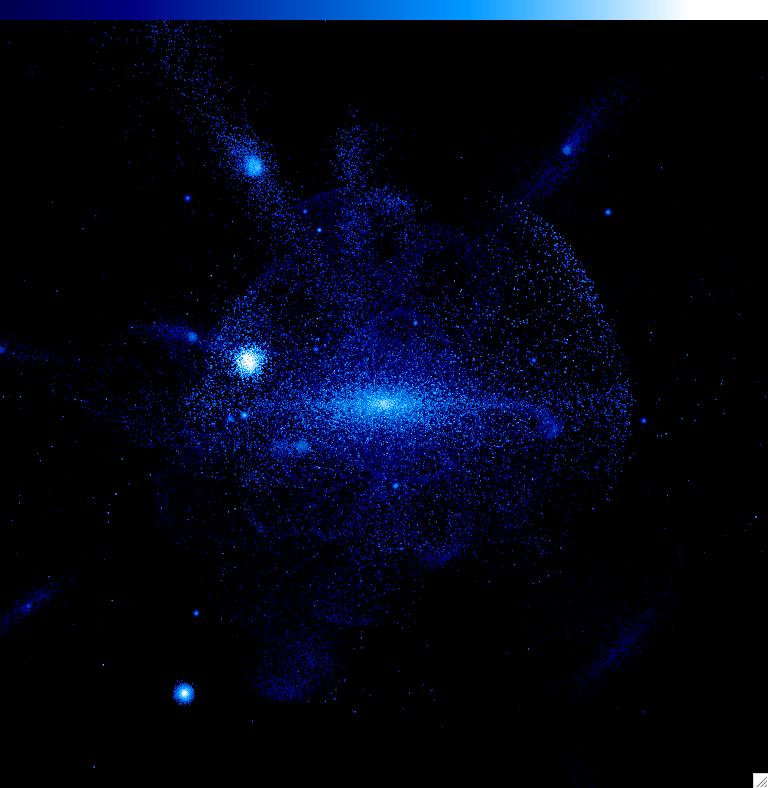
External
Surface Brightness Images.
Shown is the halo on the far right above, now cut at various surface
brightness limits.
From left to right, black= 40, 35, 32, 30, and 28 Magnitudes per square
arcsecond.
Click on an image for a larger version.
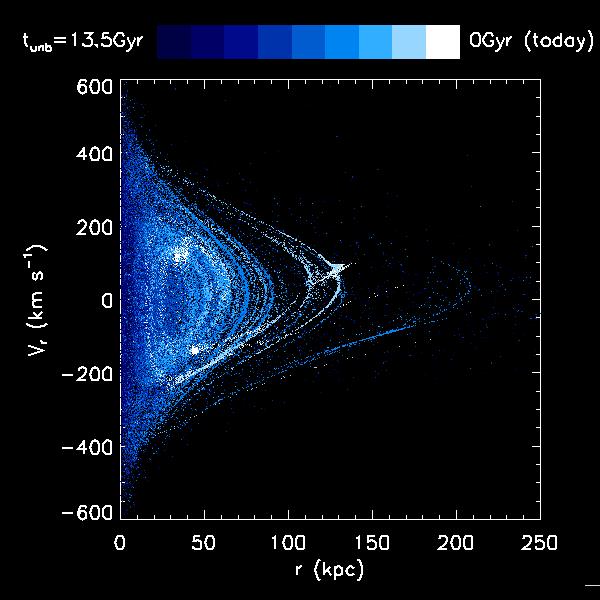
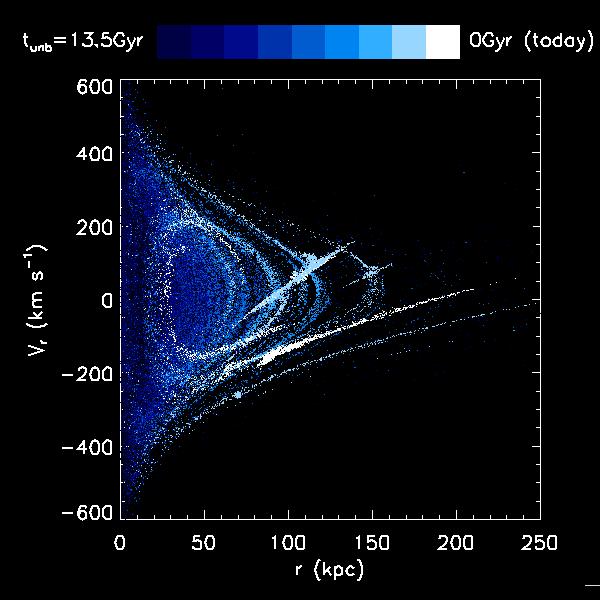
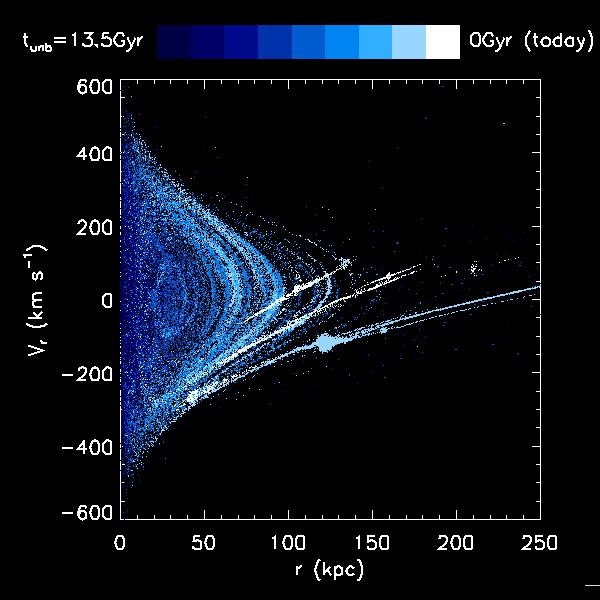
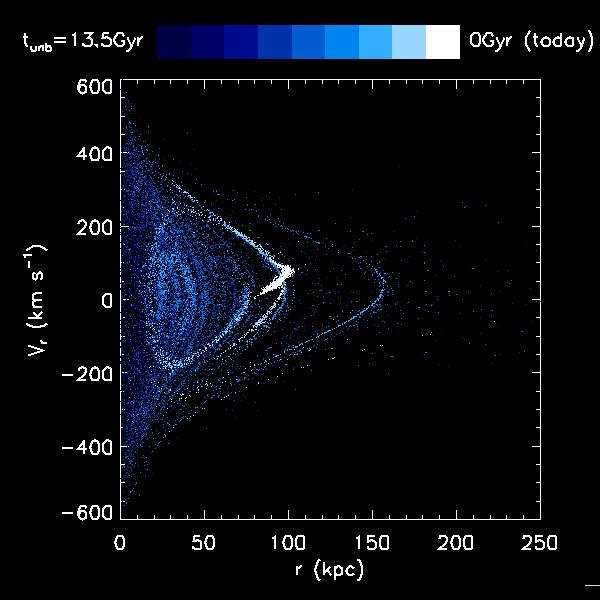
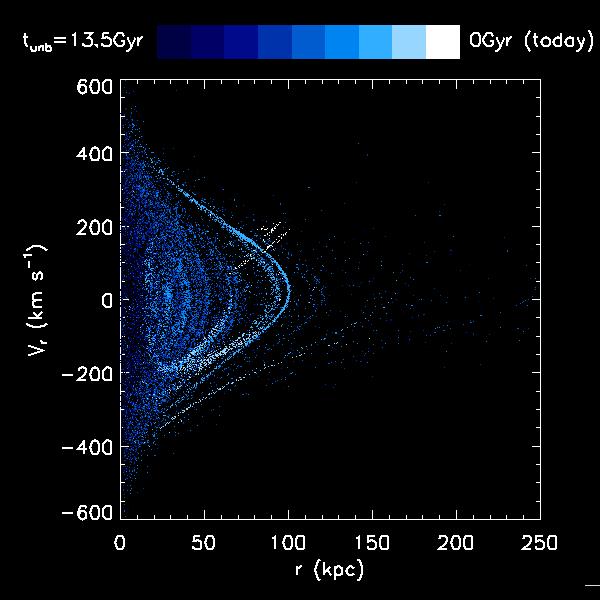
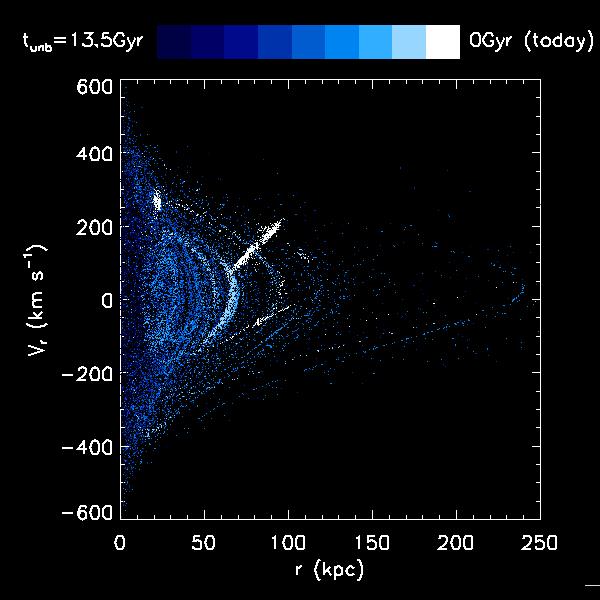
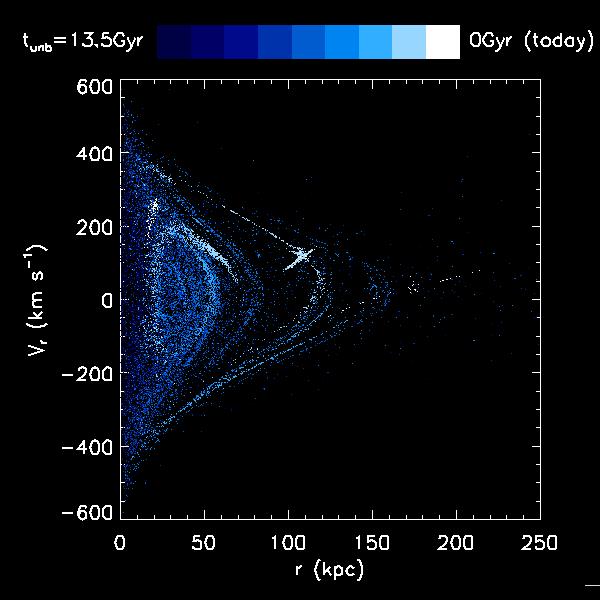
Phase
diagrams: radial velocity vs. radius for entire halos.
Each figure mathes halos with the image above.
Each point represents 1000 solar luminosities in V.
Colors indicate the lookback time when each star was unbound from its
satellite: 13.5Gyr = dark blue, 0Gyr = white
Click on image for larger picture.
Phase diagrams for 4 quarters of
the sky for first halo on the left, above.
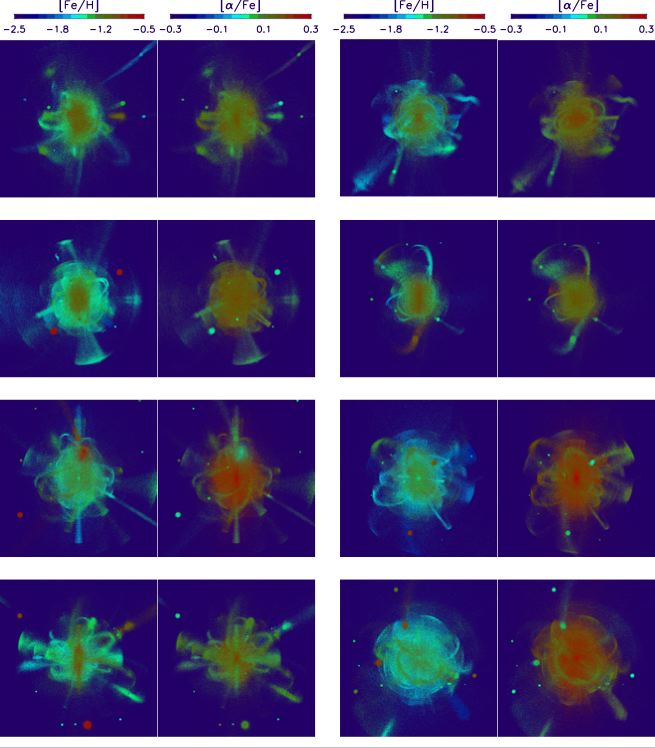
From Font et al.
2006 (astro-ph/0512611):
Metallicity Maps: Chemical Abundance maps in 8 simulated
halos. Color code in [Fe/H] (left sub-panesl) and [alpha/Fe]
(right sub-panels). Each pixel is 0.25kpc on a side through
300kpc deep. Boxes are 300kpc on a side.
V-band
surface brightness maps: Left sub-panels show the surface
brightness map of all stars and right sub-panel shows surface
brightness for only stars with [alpha/Fe]<0.25. Each panel is
300 kpc on a side. (Font et al. 2006).
|