TUTORIAL
Main page: http://www.physics.uci.edu/~foams
Download all files: foam_code.tar.gz
Contents
- READ RAW DATA AND OBTAIN CENTROID POSITIONS
- MAKE VORONOI CONSTRUCTION
- CHARACTERIZING POLYDISPERSITY
- FIND NEAREST AND NEXT NEAREST NEIGHBORS
- EXECUTION WITHOUT USER INTERACTION AND DISPLAY
- GENERATE MAPPING FILE
- VELOCITY PLOT
- T1 EVENTS
- LAGRANGIAN TO EULERIAN VELOCITIES
- BOND ORDER PARAMETER
- ADDITIONAL UTILITES
- CODE UNDER DEVELOPMENT
- - Stress tensor
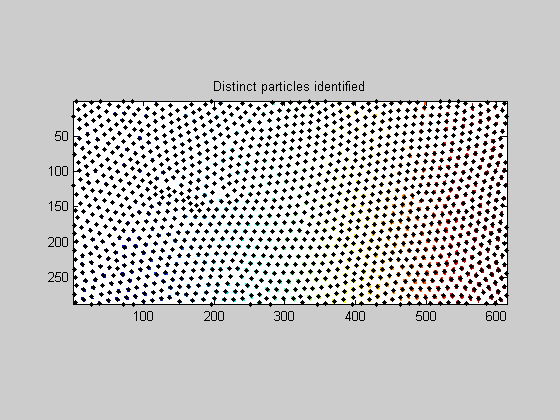
READ RAW DATA AND OBTAIN CENTROID POSITIONS
% Input for image filename and directory containing the file
filename='image0.bmp';pathname='../images/';

% centers_list reads the file, filters it using the structure 'Params'. If
% 'Params is empty (as below), a user interface is started to obtain the
% croping and filtering parameters. P_0 is a 4 column array with the 2nd
% and 3rd columns being the Y-X positions of the centroids.
Params=struct([]);
[P,filename,pathname,Params]=centers_list(filename,pathname,Params,'ON');
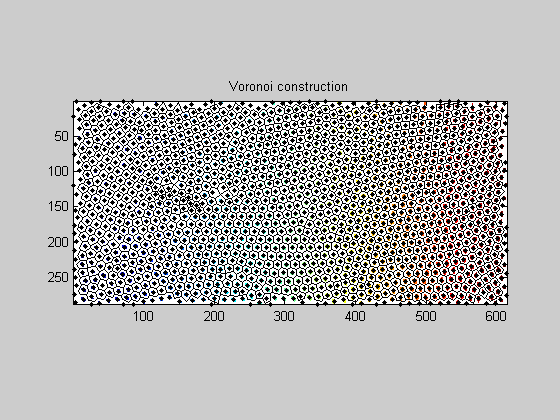
MAKE VORONOI CONSTRUCTION
center positions of the distinct elements is used to generate a Voronoi diagram. V, E and C refer to the vertices, edges and cells of the diagram. bdry_cells are indices of cells at the boundary.
center_positions=P(:,[2 3]);
[V,E,C,bdry_cells]=vertex_edges_cells(center_positions,'ON');
CHARACTERIZING POLYDISPERSITY
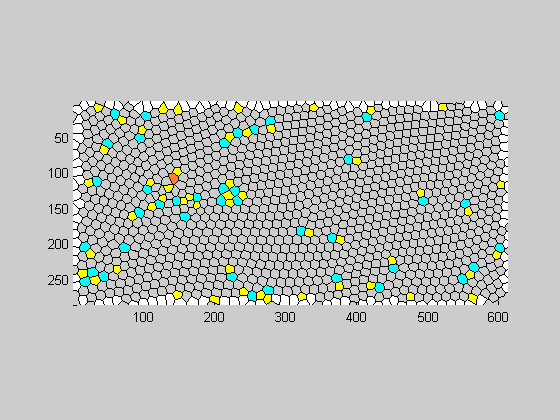
The polydispersity of the cells can be checked using the following code. This is done by measuring the area of cells A and the number of sides n. A graphic ouput with colors corresponding to the number of sides may also be displayed using display_number_neighbors
[A,n]=dispersity(V,C);
figure;display_number_neighbors(V,E,C,bdry_cells);
FIND NEAREST AND NEXT NEAREST NEIGHBORS
The neighbors and next nearest neighbors are indicated in matrices N and NN. NC is a connectivity matrix specifying the number of common vertices between cells. To make the code efficient, neighbors are extracted only within a pre-defined 'neighbor_region'.
neighbor_region=50;
[N,NN,NC]=neighbors(C, center_positions, neighbor_region);
EXECUTION WITHOUT USER INTERACTION AND DISPLAY
The below computation will be used in extracting dynamics such as velocities and T1 events. Note that in this case, the display is suppressed for efficiency. In addition, the variable 'Params' is used as generated earlier.
filename='image1.bmp';pathname='../images/';
[P_1,filename,pathname,Params]=centers_list(filename,pathname,Params,'OFF');
center_positions_1=P_1(:,[2 3]);
[V_1,E_1,C_1,bdry_cells_1]=vertex_edges_cells(center_positions_1,'OFF');
neighbor_region=50;
[N_1,NN_1,NC_1]=neighbors(C_1, center_positions_1, neighbor_region);

% For aesthetic reasons, we rename some variables
P_0=P;V_0=V;E_0=E;C_0=C;bdry_cells_0=bdry_cells;N_0=N;NN_0=NN;
GENERATE MAPPING FILE
Identical particles indexed differently in 'P_0' and 'P_1' form the rows in the array 'mapping'. Two particles are identical if they have been displaced within a region_of_motion (X and Y regions may be distinct), have the minimal displacement within this region, and have a similar area.
reg_of_motion=50*[1 1];
mapping=two_frame_mapping(P_0,P_1,reg_of_motion);
VELOCITY PLOT
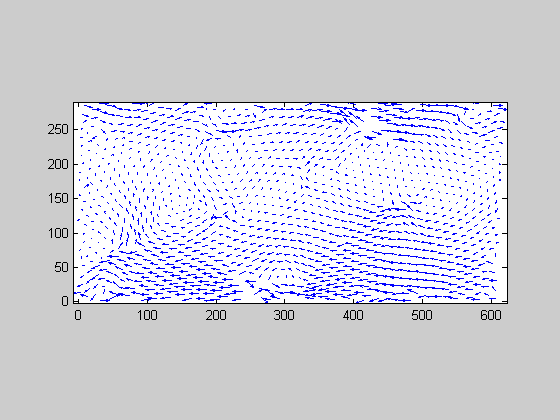
The mapping file above is used to generate a plot of the displacement between identical particles indexed in 'mapping' above. For rigor, this should be divided by the time difference beween the two measurements.
velocities_mapping=P_1(mapping(:,2),[2 3])-P_0(mapping(:,1),[2 3]);
figure;quiver(P_1(mapping(:,2),2),P_1(mapping(:,2),3),velocities_mapping(:,1),velocities_mapping(:,2));
axis equal;axis image;
T1 EVENTS
The Nighbor and Next-Nearest neighbor data is used to identify cells that undergo T1 events. T1_0_N and T1_0_NN contain indices to cells that are Nearest neighbors and Next nearest neighbors initially during a T1 event. These indices correspond to those in P_0. Similarly, T1_1_N and T1_1_NN are for cells in the finally nearest and next-nearest neighbors, with indices as in P_1.
[T1_0_N,T1_1_N,T1_0_NN,T1_1_NN,nbr_slp_0,nbr_slp_1]=T1_list(mapping,bdry_cells_0,bdry_cells_1,N_0,N_1,NN_0,NN_1);
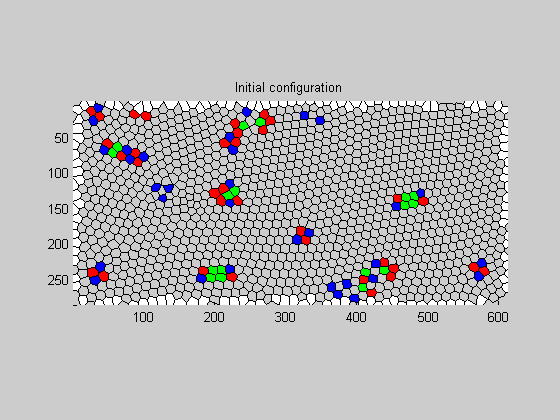
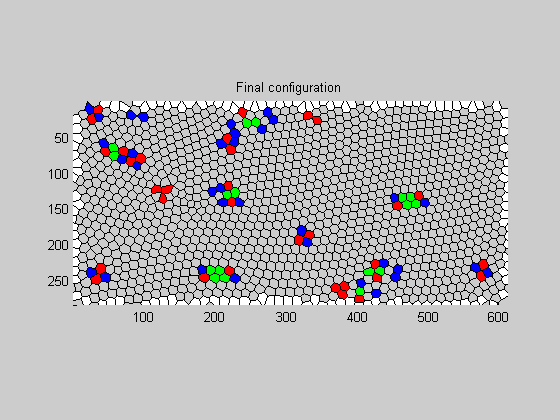
%In the below plots, the red cells are neighbors, blue cells are
%next-nearest neighbors during T1 events. Where multiple T1 events coincide,
%the green cells indicate those that are both neighbors and next-nearest
%neighbors. The first plot is for the initial configuration, and the second
%plot is for the final configuration of the cells.
figure;plotT1(V_0,E_0,C_0,T1_0_N,T1_0_NN,bdry_cells_0);title('Initial configuration');
figure;plotT1(V_1,E_1,C_1,T1_1_N,T1_1_NN,bdry_cells_1);title('Final configuration');
LAGRANGIAN TO EULERIAN VELOCITIES
Occasinally, one would need to track the motion of individual particles through the flow field. The function mapping_table does this in the form of two variables: bub_start_stop is an array with the start and stop values of the frame number when a bubble appears and dissappears. bub_trak lists the indices of the bubble as specified in the 'P' variable described above. Also build_trajectores outputs the X and Y coordinates from these variables.
% THESE PROGRAMS ARE BEST USED IN BATCH PROCESSING AND ARE PROVIDED AS
% SUCH. To run in batch mode, save the 'P' variable and 'mapping' variable
% to .mat files in a directory. Slight modifications of the below programs
% may be required in reading these files.

[bub_trak, bub_start_stop]=mapping_table(im_no_start,im_no_end);
[bub_pos_1,bub_pos_2]=build_trajectories(bub_trak,bub_start_stop,im_no_start,im_no_end);
BOND ORDER PARAMETER
The bond order parameter is computed for each individual particle based on the orientation of its nearest neighbors. This is a measure of the crystallinity of the medium. For hexagonal packing, l=6.
l=6;
BondOrder=bond_order_parameter(center_positions, N, l);
ADDITIONAL UTILITES
The following code samples may be useful in some customization and extraction of additional parameters.
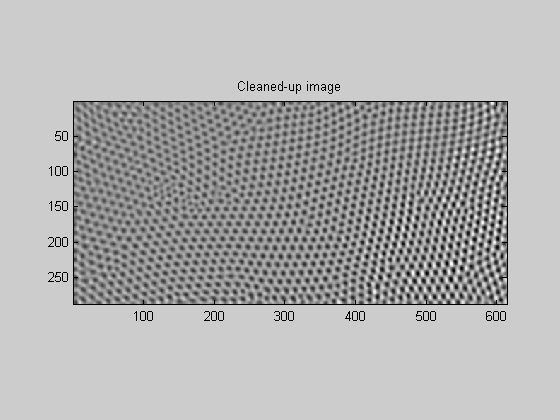
% The below program is used by centers_list.m in cleaning up the image. The
% present version performs croping of the image in a rectangular geometry
% and a Fourier filter.
[img,Params]=CleanImage(rawimg,Params);
% A new mapping between frames (1-3) is made from mapping parameters linking frames (1-2) and (2-3)
new_map=contract_mappings(mapping_1,mapping_2);
% The below makes a list of indicies of particles that are neighbors of
% each other.
Nbr_ctr_cnct=neighbor_center_connect(N);
CODE UNDER DEVELOPMENT
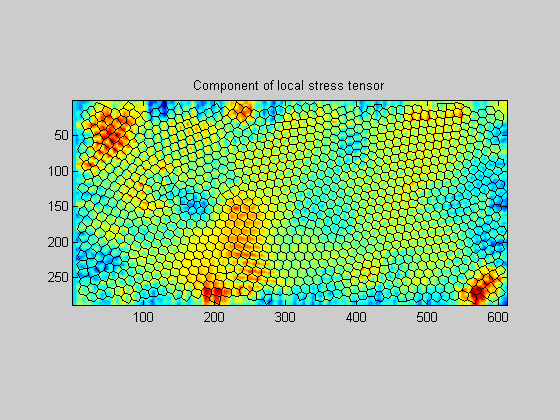
- Stress tensor
The stress in the network is computed from purely geometrical considerations of the network. This is akin to the deviatoric stress used in describing cellular structures, and may be computed from knowledge of the edges comprising the cell structures.
volume=1;
S=stress_tensor(E,V,volume)
S =

  1.0e+004 *

    1.3587    0.0395
    0.0395    1.3126
% Further, a local measurement is possible by looking at small
% neighborhoods of the network. The variable 'box_size' is a number that
% specifies half the length of the box over which the averaging occurs to
% compute a local stress.

box_size=20;
S_local=stress_tensor_local(V,E,box_size);

imagesc(S_local(:,:,3)');for ic=1:size(E,1), line([V(E(ic,1),1) V(E(ic,2),1)],[V(E(ic,1),2) V(E(ic,2),2)],'color',[0 0 0]);end;axis image;title('Component of local stress tensor');