|
Creating and Characterizing Individual Molecular Bonds with a
Scanning Tunneling Microscope
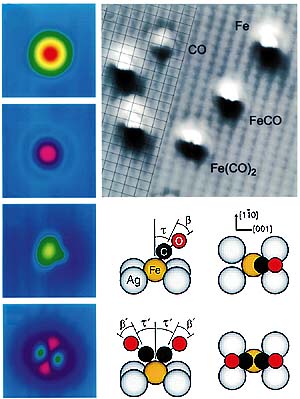
In high school chemistry experiments, its easy to follow a chemical reaction: Mix the chemicals in a test tube, and watch for a change of color, fizzing, or some other sign of chemical transformation. But what do you do if you want to probe the spatial limits of chemistrythat is, to initiate and examine an individual chemical reaction? In a recent paper in Science, Wilson Ho of Cornell University and his graduate student Hyojune Lee provide an answer.1 By using a scanning tunneling microscope (STM), Ho and Lee combined atoms and molecules on a metal surface to make new molecules. But thats not all they accomplished. To confirm the chemical identity of their molecular creations, they measured the individual molecules vibrational energiesagain with the STM. Their results are truly remarkable, comments the University of Marylands Ellen Williams, not just creating the bonding, but also the single-molecule spectroscopy. The other half In principle, the properties of any given chemical bond can be completely solved with quantum mechanics, but in practiceespecially in the case of molecules adsorbed on surfacesits not so easy. And thats why we need very accurate data at the molecular level, explains Ho. The two Cornell researchers chose to combine iron atoms and carbon monoxide molecules on a silver surface. Not only are metal carbonyls (as the compounds of metals and CO are known) relatively simple, but they are also among the best-studied compounds in surface science, thanks to the importance of the metalcarbonyl bond in industrial catalysis. Even so, it has proven difficult to determine how many CO molecules attach themselves to the metal atoms, and how they are bonded. To begin their experiments, Lee and Ho sprinkled a sparse layer (0.001 monolayer) of Fe atoms on the Ag surface by evaporating Fe over the surface at 13 K. They repeated the procedure with CO (also at 0.001 monolayer) to create a mixed covering of adsorbates, whose positions they determined with their STM. To form Fe(CO), they first positioned the STM tip over a CO molecule and then increased the tunneling current and voltage to draw the molecule from the surfacea technique demonstrated three years ago by Ludwig Bartels, Gerhard Meyer, and Karl Heinz Rieder at the Free University of Berlin.3 Next, Lee and Ho positioned the tip over an Fe atom, reversed the current and reduced the voltage to deposit the CO molecule. In the last step of molecule building, they created Fe(CO)2 by depositing a second CO molecule on the newly created Fe(CO) molecule. The column of false-color images in the figure below shows how the various adsorbates appear to the STM. In the top two images, Fe and CO look symmetric, which means, in the case of CO, that the molecules bond is vertical. However, the image of Fe(CO) is lopsided, indicating that the CO molecule is tilted with respect to the surface. The image of Fe(CO)2 has two matching side lobes, each corresponding to a CO molecule.
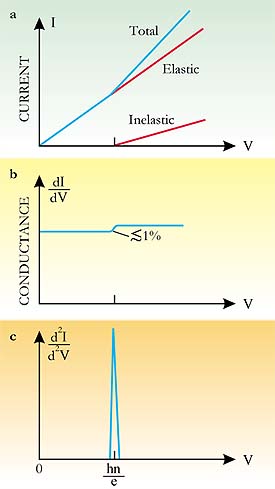
Tis in the bond The phenomenon is inelastic because electrons excite molecular vibrations (thereby losing energy) as they tunnel across the gap. But the electrons can excite a vibration only if they retain enough energy to land above the Fermi level when they reach the other side of the gapthat is, provided the voltage V is such that eV > hn. Because the changes in dI/dV are small and hard to spot, IETS practitioners plot d2I/dV2, which, as shown in the adjacent figure, should appear as a sharp peak at a voltage of hn/e. IETS has been successfully applied to various junction systems for some time, but it wasnt until 1998 that Ho with his graduate students Barry Stipe (now at IBMs Almaden Research Laboratory) and Mohammad Rezaei (now at Transaction Information Systems, Inc) obtained the first IETS spectrum of a single moleculeacetylenewith an STM.5 In effect, their technique makes a junction of the surface, molecule, and tip, and involves positioning the STM tip over the molecule, turning off the feedback (which controls the tips vertical displacement) and ramping the tunneling voltage from a preselected initial value through the expected vibrational peak to an upper value and back down again. Despite its conceptual simplicity, the technique of using an STM for vibrational spectroscopy is extremely exacting. The STM tip has to be positioned over the molecule with a precision finer than 0.01 nm horizontally and 0.001 nm vertically. Temperatures lower than 10 K are required to reduce the temperature-dependent broadening of the d2I/dV2 peak. And background is a problem. Bumpy features in the signal arise not only from vibrational modes, but also from the acute sensitivity of d2I/dV2 to the electronic structure of the tip-molecule-surface junction. Even when the ploy of plotting d2I/dV2 against V is used, the vibrational peak may be impossible to discern because it is mixed in with background features.
Fortunately, Ho and his group had another trick up their sleeves: isotopic substitution. As well as making Fe(CO) and Fe(CO)2 with isotopically normal 12C16O, they also made Fe(13C18O), Fe(13C18O)2, and Fe(12C16O)(13C18O). Isotopic substitution helps not only to associate the peaks with vibrational modesbecause it shifts the peaks by a predictable amountbut also to mitigate the background featuresbecause the isotopically substituted spectrum can be subtracted from the unsubstituted spectrum. The value Lee and Ho obtained for the vibrational energy of the CO stretch in Fe(CO), 236 meV, is close to the value of 234 meV obtained with infrared spectroscopy for a layer of CO adsorbed on a Fe surface. And the shifts in energy due to isotopic substitutions match not only theoretical predictions for gaseous iron carbonyl and bicarbonyl, but also experimental measurements for CO bonded to iron in hemoglobin. Furthermore, the small difference in the CO stretch energy between Fe(CO) and Fe(CO)2 agrees with the value calculated for gaseous molecules. The Cornell groups feat impresses Weiss: What many of us were afterand what Wilson was able to do a couple of years ago nowwas to record the vibrational spectrum of a single molecule to identify the molecule unambiguously. Here, he uses it in combination with STM manipulation to put together a molecule and confirm what he made. Its a spectacular piece of science. Successfully measuring the vibrational spectrum of a single CO molecule, difficult though it is, does not mean that any molecule can be characterized in that way. For one thing, experiments have shown that not all the vibrations of a molecule are observable, and some peaks are even negative. Moreover, the influence of the surface shifts the vibrational energies from their values in the liquid and gas phases. But as more data are collected, the mechanisms that underlie STM-IETS are becoming better understood and, believes Ho, portend the use of vibrational spectra as the fingerprints of adsorbed molecules. Theorists are also tackling STM-IETS. To predict changes in differential conductance across vibrational energies, Nicolas Lorente and Mats Persson of Chalmers University of Technology and Göteborg University start with the TersoffHamann theory of STM images. They add the electronic structure of an adsorbed molecule calculated using density functional theory, and then use perturbation theory to calculate the coupling between the tunneling electrons and the vibrations. Experiments are well ahead of theory, admits Persson, but were getting there. --Charles Day References
© 1999 American Institute of Physics
|