Abstract
Introduction
Experiment
Results
Discussion
References
Projects Page
|
 |
Discussion
 The
most salient feature of the data is the thickness steps found for 3He
on Cs near Dm= -0.6K. A question that arises
from these measurements is whether these steps are due to first order prewetting
transitions or are merely regions of high 2D compressibility in the adsorbed
films. The
most salient feature of the data is the thickness steps found for 3He
on Cs near Dm= -0.6K. A question that arises
from these measurements is whether these steps are due to first order prewetting
transitions or are merely regions of high 2D compressibility in the adsorbed
films.
There are two examples
of similar adsorption systems for which first order prewetting is firmly
established: 4He on cesium [3] and H2 on rubidium
[4,6]. In these systems, first order prewetting was established through
the connection of the prewetting line with a first order wetting transition.
At temperatures just above the wetting temperature, thermodynamics requires
that the steps are first order prewetting transitions. In the case of 3He,
since there is no wetting transition, a parallel argument cannot be made
and the identification of the steps with prewetting must rely on other
features of the data.
A well known signature
of first order phase transitions is hysteresis. In order to determine if
the 3He/Cs steps were hysteretic a small amount of 3He
was admitted to the experiment cell and the temperature was raised and
lowered between ~0.35 K and ~0.40 K, so that the chemical potential was
swept back and forth over the region of the step. No hysteresis in Dm
larger than the experimental resolution, about 10 mK, was found.
Unfortunately this bound on the hysteresis is too large to be useful since
the steps occur at low temperatures and far from saturation where hysteresis
would be expected to be very narrow.
If the steps found
in the 3He isotherms at low temperatures are first order transitions,
then there should be an indication of an upper critical point for the prewetting
line. A conventional method used to determine the critical points for phase
transitions in 2D systems is to examine the temperature dependence of the
inverse steepness of the steps, (-dm/df), found
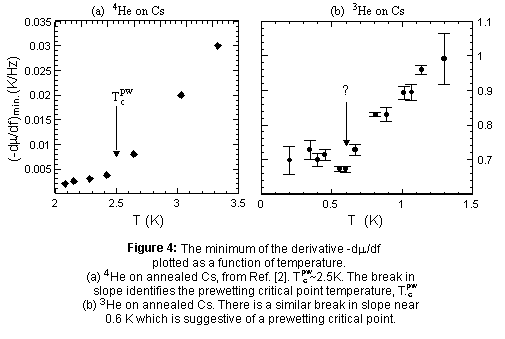
in the isotherms [3,12,13]. Fig. 4 illustrates this analysis for 4He
on annealed cesium as well as a similar analysis of the 3He
adsorption data. Fig. 4(a) is a plot of the minimum of the (-dm/df)min
derivative from Ref[3] for 4He adsorption isotherms measured
on a cesium plated microbalance similar to the one used for this experiment.
Below 2.5 K (-dm/df)min is very small
(corresponding to very steep steps) and nearly constant. Above 2.5 K (-dm/df)min
increases rapidly with increasing temperature. This indicates that the
prewetting critical point temperature is Tpwc= 2.5K.
For comparison, the same
derivative of the 3He data measured on the third annealed cesium
substrate is shown in Fig. 4(b). The dependence of the derivative on temperature
is qualitatively similar to that for 4He. Below about 0.6 K,
the derivative is nearly constant, and at higher temperatures it increases
rapidly. This result can also be obtained by a visual inspection of the
data of Fig. 3. The four lowest temperature isotherms (measured at temperatures
less than 0.6 K) are nearly identical, whereas the steps in the two isotherms
measured above 0.6 K are clearly less steep. This behavior is suggestive
of a first order prewetting line with a critical point at ~0.6 K.
The results for 3He
on annealed Cs are summarized in Fig. 5. The plot shows the positions of
the points of maximum slopes from isotherms measured using the first and
second annealed cesium substrates. The location of the steps is essentially
parallel to the bulk coexistence curve, consistent with the expectation
that 3He wets Cs at all temperatures.
A clear difference between
the isotherms measured for 3He and 4He is that the
steps in the 3He case are ~20 times wider than those found for
4He [14]. In order to make a convincing argument that the 3He/Cs
steps are due to first order prewetting transitions, an explanation must
be offered for their large width. A possible cause of the finite width
of the steps is residual inhomogeneity of the substrate. To explore the
possibility that 3He prewetting might be more sensitive to inhomogeneity
than 4He prewetting we considered a simple model of the effect
of variation of the substrate potential. Using Eqn. 2.5 from Ref[15] we
calculated the effect of a small variation of the depth of the substrate
potential (the parameter D from Ref[15]) on the location of the
prewetting step. The results indicate that first order prewetting steps
should be broadened by about the same amount for both 3He and
4He on Cs. Therefore, this type of inhomogeneity cannot explain
our results.
In an attempt to experimentally
explore the effect of inhomogeneity we measured isotherms of 3He
and 4He on both annealed and unannealed substrates. As a result
of annealing, the steps found for both 3He and 4He
became sharper, and were shifted to lower chemical potentials, but the
maximum slopes of the steps were left relatively unchanged.
Pricaupenko and Treiner
(PT) [7] have made predictions of the adsorption behavior of 3He
on cesium at T = 0 K. In their theory the Fermi statistics of the 3He
dictates the wetting behavior. They have predicted quantum prewetting transitions
which are driven by the successive filling of 2D Fermi disks at the surface.
In addition to a large prewetting transition, this theory predicts a series
of smaller film thickness transitions between the prewetting transition
and bulk coexistence.
The calculations of PT
predict a prewetting transition for 3He on Cs at Dm=
-0.2K. The data show a step at Dm= -0.6K. This
disagreement seems significant because the parameters describing the substrate
potential used in the model were adjusted to give a correct result for
the calculated wetting temperature of 4He on Cs.
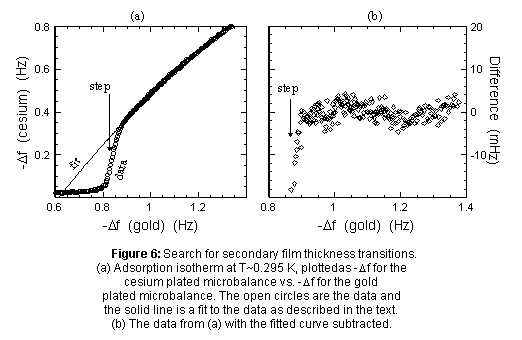
A
careful search for any sign of the predicted secondary film thickness transitions
was done at T = 0.295 K using the second annealed cesium surface. The results
are shown in Fig. 6. The graph of Fig 6(a) shows the adsorption isotherm
plotted as -Df for the cesium plated microbalance
vs. -Df for the gold plated microbalance. The
open circles are the data and the solid line is a second order polynomial
fit to the data in the range 1< -DfGold<
1.4. To uncover any small features of the data that may be obscured by
the steeply sloped background we subtracted the fitted curve from the data.
The results are shown in Fig. 6(b). One large step is clearly evident in
both graphs but no other features can be found in the data. A simple calculation
showed that if secondary thickness transitions were present, they should
have been revealed by the analysis of Fig. 6 even if they were smeared
to a width similar to that of the measured steps. Since no evidence for
the secondary transitions was found in the data we conclude that they do
not occur in the 3He/Cs system for temperatures greater than
0.3 K.
In conclusion, 3He
is found to wet cesium at all temperatures. The measured isotherms show
very little adsorption until a chemical potential about 0.6 K below saturation
where there are step-like features. We have explored the possibility that
these steps may be due to first order prewetting transitions by analyzing
the width and steepness of the steps. Because of the lack of a natural
scale of steepness it is difficult to come to a definitive conclusion on
this point. A similar problem plagues the comparison between theory and
experiment. Extraordinarily long relaxation times have limited our measurements
to temperatures above 0.2 K, but the theory applies strictly at T = 0 K.
If in fact the theory is applicable only for temperatures for which monolayer
thick film are degenerate, temperatures in the low mK ranged would be required
[16]. A conclusive confrontation between theory and experiment will require
a calculation finite temperature effects.
This work was supported by NSF grant DMR-9223775.
|
|